Figure 11-3
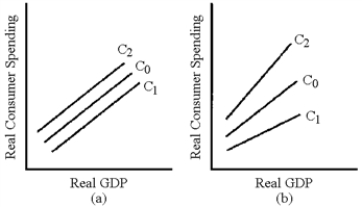
-In Figure 11-3, which line represents the change in the consumption schedule caused by a cut in the personal income tax as advocated by President George W.Bush in 2001?
A) C1 in graph (a)
B) C2 in graph (a)
C) C1 in graph (b)
D) C2 in graph (b)
Correct Answer:
Verified
Q187: Table 11-1 Q188: Why does the numerical value of the Q189: The Reagan tax cuts of the 1980s Q190: Table 11-1 Q191: In the short run, tax cuts that Q193: Which of the following factors has the Q194: Figure 11-3 Q195: Explain why a change in income tax Q196: Table 11-1 Q197: A Keynesian economist would expect a supply-side Unlock this Answer For Free Now! View this answer and more for free by performing one of the following actions Scan the QR code to install the App and get 2 free unlocks Unlock quizzes for free by uploading documents![]()
A)had![]()
![]()
![]()

