Figure 13-1
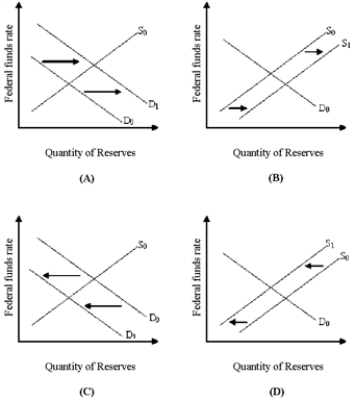
-In Figure 13-1, which panel shows the effect of a Fed open market sale on the interest rate?
A) Panel (A)
B) Panel (B)
C) Panel (C)
D) Panel (D)
Correct Answer:
Verified
Q181: What determines the magnitude of the changes
Q183: Explain how interest rates and bond prices
Q184: Under what conditions will the inflationary impact
Q188: Figure 13-1 Q188: The correct chain of causation illustrating the Q190: Which of the following has proved to Q192: Some form of financial distress can become Q193: Which of the following were not actions Q194: Figure 13-1 Q196: Figure 13-1 Unlock this Answer For Free Now! View this answer and more for free by performing one of the following actions Scan the QR code to install the App and get 2 free unlocks Unlock quizzes for free by uploading documents
![]()
![]()
![]()

