The figure below shows the relationship of the quantity demanded for iTune music downloads per day to the price of each iTune music download. 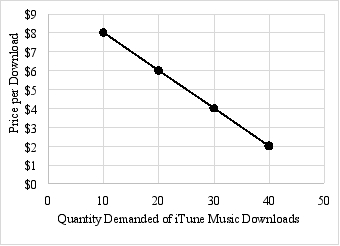 (A) If the price of iTune music dommlaats increases fram 12 per dommaad to 14 per domidaad by how much will the quantity demanded for iTune music dowrloads change?
(B) Eolnan how yaur anser in part (A) relies on the ceteris paribm assumption.
Correct Answer:
Verified
View Answer
Unlock this answer now
Get Access to more Verified Answers free of charge
Q42: Economists develop new models only when new
Q43: A major reason for the development of
Q50: A market economy in which the government
Q54: Explain how economic models are similar to
Q55: Explain how new models or theories are
Q62: A laissez faire system is an economy
Q68: In modern market economies, the role government
Q70: Which of the following statements is true?
A)Normative
Q76: Karl Marx argued that capitalism would eventually
Q78: Positive economics is the
A)study of the desirable
Unlock this Answer For Free Now!
View this answer and more for free by performing one of the following actions

Scan the QR code to install the App and get 2 free unlocks

Unlock quizzes for free by uploading documents