The diagram below shows two production possibilities boundaries for Country X. 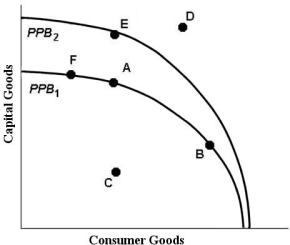 FIGURE 1- 3
-Refer to Figure 1- 3. Suppose that Country X is currently producing at point E. Country X could achieve production at point D if
A) firms reduced output of capital goods.
B) sufficient improvements in technology occurred in either the capital goods industry or the consumer goods industries.
C) the given resources were more efficiently employed.
D) the given resources were fully employed.
E) the prices of capital goods and consumption goods fell.
Correct Answer:
Verified
Q19: Many economies in central and Eastern Europe,including
Q26: The table below illustrates that,in one day,Tristan
Q42: The key decision makers in a market
Q44: The famous economist who developed the idea
Q46: An economic system that relies primarily upon
Q47: Which of the following has most contributed
Q50: Behaviour in free- market economies is
A)determined by
Q53: In the circular flow of income, the
Q54: Economists usually assume that households
A)make consistent decisions,
Q60: The table below shows that, in
Unlock this Answer For Free Now!
View this answer and more for free by performing one of the following actions

Scan the QR code to install the App and get 2 free unlocks

Unlock quizzes for free by uploading documents