55 The three diagrams below each show a supply curve for oil tankers over a relatively short period of time. 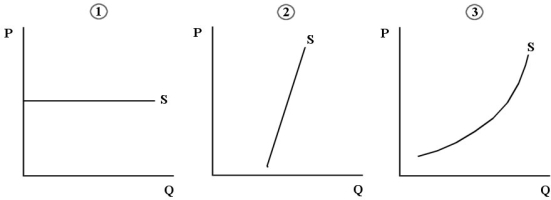 FIGURE 13- 3
-Refer to Figure 13- 3. Consider the supply of oil tankers to an individual Canadian firm, the North American shipping industry, and the world shipping industry. Which diagram best shows the supply of oil tankers that is relevant to the North American shipping industry?
A) diagram 1
B) diagram 2
C) diagram 3
D) diagrams 2 or 3
E) diagrams 1 or 2
Correct Answer:
Verified
Q3: Consider labour that is hired for $18
Q110: When studying income distribution, the Classical economists
Q111: The diagram below shows the MRP curve
Q112: The "functional distribution of income" refers to
Q113: Alfred Marshall's concept of "transfer earnings" denotes
A)
Q114: A monopolist will continue to increase production
Q116: The table below shows the total
Q117: The value of a factor in its
Q119: Other things equal, if a particular province
Q120: Consider a small firm that is producing
Unlock this Answer For Free Now!
View this answer and more for free by performing one of the following actions

Scan the QR code to install the App and get 2 free unlocks

Unlock quizzes for free by uploading documents