 FIGURE 13- 1
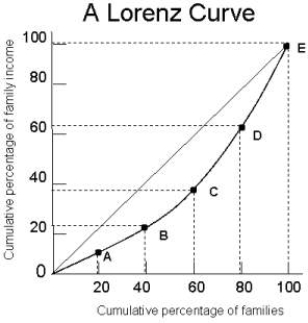
-Refer to Figure 13- 1. The diagonal line in the diagram
A) has no real purpose.
B) shows where the Lorenz curve would be if there were complete income equality.
C) illustrates the functional distribution of income.
D) shows the actual distribution of income.
E) shows that 100 percent of families earn 100 percent of the income.
Correct Answer:
Verified
Q11: Consider the following production and cost schedule
Q48: Consider labour that is hired for $18
Q49: Choose the statement that best describes the
Q51: Which of the following is the best
Q53: The "size distribution of income" refers to
Q54: Consider labour that is hired for $18
Q55: If a technological change makes it easier
Q56: Consider a small firm that is producing
Q57: Equilibrium factor- price differentials
A) may be caused
Q114: Consider the following demand and supply curves
Unlock this Answer For Free Now!
View this answer and more for free by performing one of the following actions

Scan the QR code to install the App and get 2 free unlocks

Unlock quizzes for free by uploading documents