 FIGURE 2- 4
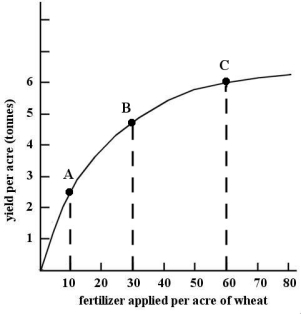
-Refer to Figure 2- 4. This non- linear function shows that over the range shown,
A) as the yield per acre increases, the amount of fertilizer required per acre is diminishing.
B) as the yield per acre increases, the amount of fertilizer required per acre is increasing.
C) as more fertilizer is applied, the marginal response in yield is increasing
D) as more fertilizer is applied, the marginal change in yield is diminishing.
E) as more fertilizer is applied, the total yield per acre is diminishing.
Correct Answer:
Verified
Q11: The statement that a country's rate of
Q12: Suppose economists at the World Bank discover
Q18: On a coordinate graph, what is the
Q20: Which of the following statements is NOT
Q21: Suppose that a particular theory predicts that
Q25: Consider the line which is the graph
Q27: As a science, economics is disadvantaged in
Q28: Suppose an economist tells you that the
Q33: Suppose point A represents coordinates (X =
Q34: An unweighted index number
A)has different weights for
Unlock this Answer For Free Now!
View this answer and more for free by performing one of the following actions

Scan the QR code to install the App and get 2 free unlocks

Unlock quizzes for free by uploading documents