The diagram below shows a set of budget lines facing a household. 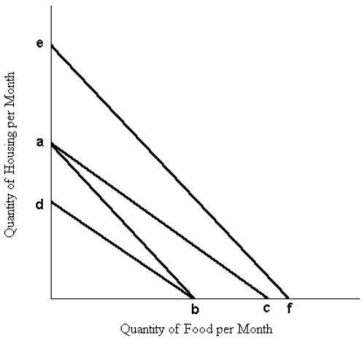 FIGURE 6- 7
-Refer to Figure 6- 7. The movement of the budget line from ab to ac could be caused by
A) an increase in the price of food.
B) a decrease in the price of housing.
C) a decrease in the price of food.
D) an increase in money income.
E) an increase in the price of housing.
Correct Answer:
Verified
Q4: The table below shows the quantities of
Q79: A basic hypothesis of marginal utility theory
Q80: The total value that Doug places on
Q81: An equal proportional increase in money income
Q82: Consumer surplus
A) is the total value that
Q84: If money income is reduced by half,
Unlock this Answer For Free Now!
View this answer and more for free by performing one of the following actions

Scan the QR code to install the App and get 2 free unlocks

Unlock quizzes for free by uploading documents