The diagram below shows a set of budget lines facing a household. 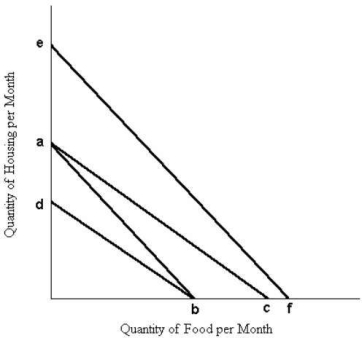 FIGURE 6- 7
-Refer to Figure 6- 7. The movement of the budget line from ab to db could be caused by
A) a decrease in the price of housing.
B) a decrease in the price of food.
C) an increase in the price of housing.
D) an increase in the price of food.
E) a decrease in money income.
Correct Answer:
Verified
Q7: Q8: Q9: Q10: Christine is allocating her household expenditure between Q11: The figures below show Chris's consumption of Q13: Q14: Suppose a consumer can purchase only two Q15: The paradox in "the paradox of value" Q16: In indifference curve analysis, the consumer's utility- Q17: Unlock this Answer For Free Now! View this answer and more for free by performing one of the following actions Scan the QR code to install the App and get 2 free unlocks Unlock quizzes for free by uploading documents![]()
![]()
![]()
![]()
![]()

