The figure below shows the isocost lines and the isoquant map for a firm producing golf tees. 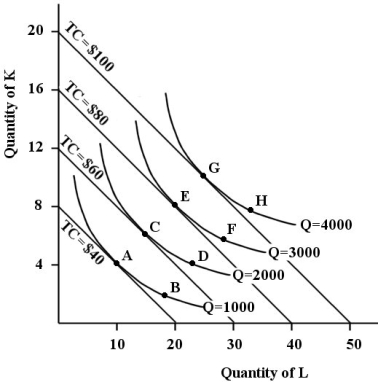 FIGURE 8- 6
-Refer to Figure 8- 6. Suppose the firm is currently producing at point E and the prices of capital and labour each increase by 30 percent. If the firm wants to minimize the cost of producing the same level of output, the firm's chosen factor combination would be at point
A) G.
B) E.
C) not determinable from the information provided.
D) A.
E) C.
Correct Answer:
Verified
Q98: A downward- sloping LRAC curve will shift
Q99: A firm's least- cost position for producing
Q100: Consider a firm that uses only labour
Q101: The fact that isoquants are downward sloping
Q102: The figure below shows the isocost lines
Q104: The following table shows the marginal
Q105: Assume a firm is using 10 units
Q106: The figure below shows the isocost lines
Q108: The table below shows the number
Q119: ![]()
Unlock this Answer For Free Now!
View this answer and more for free by performing one of the following actions

Scan the QR code to install the App and get 2 free unlocks

Unlock quizzes for free by uploading documents