The figure below shows a family of cost curves for a firm. The subscripts 1, 2, and 3 for the SRATC curves refer to different plant sizes. 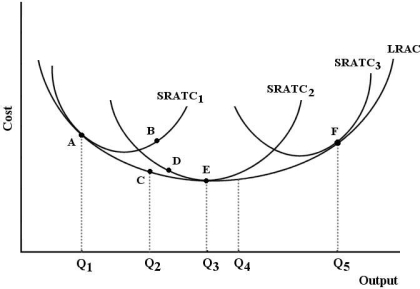 FIGURE 8- 3
-Refer to Figure 8- 3. Suppose this firm is producing output level Q3 with plant size 2. Now suppose this firm changes to plant size 3 and is producing output level Q5. We can say that
A) output has increased exactly in proportion to the increase in inputs.
B) output has increased less than in proportion to the increase in inputs.
C) output has increased more than in proportion to the increase in inputs.
D) this firm has experienced economies of scale.
E) the firm is then operating with the optimal plant size.
Correct Answer:
Verified
Q76: Q77: Q78: Which of the following cost curves demonstrate Q79: Movement from one point to another along Q80: Of the following, which is the least Q82: Canada has a much lower population density Q83: Although capital is a variable factor in Q84: Which of the following paired concepts are Q85: In defining a firm's long- run average Q86: Unlock this Answer For Free Now! View this answer and more for free by performing one of the following actions Scan the QR code to install the App and get 2 free unlocks Unlock quizzes for free by uploading documents![]()
![]()
![]()

