The figure below shows a family of cost curves for a firm. The subscripts 1, 2, and 3 for the SRATC curves refer to different plant sizes. 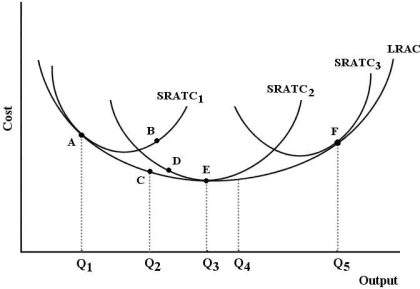 FIGURE 8- 3
-Refer to Figure 8- 3. Each of the three SRATC curves shows
A) the output that is possible when all factors of production are fixed.
B) the lowest cost attainable, given that the plant size is the largest it can possibly be.
C) the lowest cost attainable, holding the plant size constant.
D) optimal plant sizes in the long run.
E) technically inefficient methods of production, given that they lie above the LRAC.
Correct Answer:
Verified
Q56: In the long run, decreasing returns to
Unlock this Answer For Free Now!
View this answer and more for free by performing one of the following actions

Scan the QR code to install the App and get 2 free unlocks

Unlock quizzes for free by uploading documents