The diagram below shows the short- run cost curves for 3 perfectly competitive firms in the same industry. 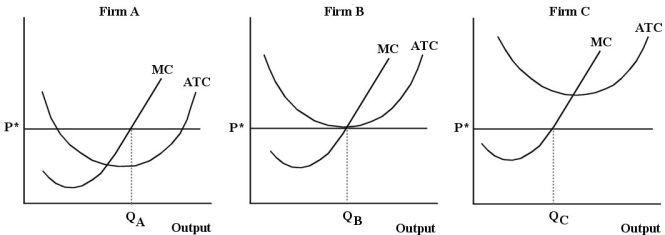 FIGURE 9- 6
-Refer to Figure 9- 6. If Firms A, B and C are in the same industry, is this industry in long- run equilibrium?
A) Yes, because P = MC = MR for each of the 3 firms.
B) Yes, because each of the 3 firms is operating at its minimum efficient scale.
C) No, because if the industry were in equilibrium, all 3 firms would be earning zero economic profits.
D) No, because Firm A is not producing at a profit- maximizing level of output.
E) Yes, because all 3 firms are producing at their minimum average total cost.
Correct Answer:
Verified
Q22: Consider the price and quantity data
Q23: Given the usual assumptions about perfect competition,
Q24: The market demand curve for a perfectly
Q26: For a perfectly competitive firm in long-
Q28: The short- run supply curve for a
Q29: If firms in a competitive industry are
Q30: When a firm is referred to as
Q31: Consider the following short- run cost curves
Q32: A perfectly competitive firm is currently producing
Q69: ![]()
Unlock this Answer For Free Now!
View this answer and more for free by performing one of the following actions

Scan the QR code to install the App and get 2 free unlocks

Unlock quizzes for free by uploading documents