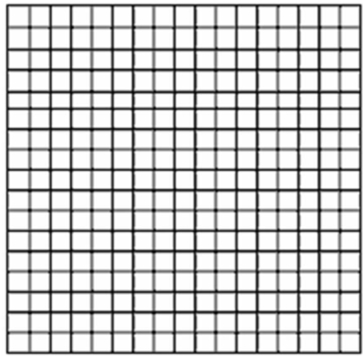
Show graphically on the below graph the expected relationship between investment spending and interest rates.Put investment expenditures on the horizontal axis and the rate of interest on the vertical axis; connect the points and label the curve "Investment demand".Describe this relationship between the rate of interest and investment expenditures.Describe the slope of the investment curve. 
Correct Answer:
Verified
View Answer
Unlock this answer now
Get Access to more Verified Answers free of charge
Q30: "The relative scarcity of resources makes the
Q31: Explain how increasing opportunity costs are reflected
Q34: "The two cornerstones of economics are the
Q37: How do income changes affect the position
Q38: A production possibilities table for two products,
Q41: Describe the adjustments in the production possibilities
Q45: An economy consists of five workers, who
Q48: How do you determine the slope of
Q51: Explain how each event affects production possibilities.(a)
Q57: One application of the production possibilities concept
Unlock this Answer For Free Now!
View this answer and more for free by performing one of the following actions

Scan the QR code to install the App and get 2 free unlocks

Unlock quizzes for free by uploading documents