The next three questions refer to the below supply and demand graph for a public good. 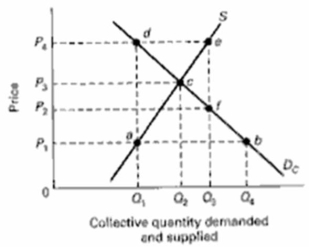 (a) What does point c represent?
(b) What does the line segment ef at output Q3 represent?
(c) At what output level is there an underallocation of resources to the production of this public good?
Correct Answer:
Verified
View Answer
Unlock this answer now
Get Access to more Verified Answers free of charge
Q4: Demand is represented by the equation, P
Q9: Demand in a market is represented by
Q13: Explain the difference between a public and
Q14: What is consumer surplus?
Q15: Supply in a market is represented by
Q19: How does the market demand curve for
Q20: What are the basic differences between a
Q20: Draw a market supply curve and indicate
Q22: The following table shows marginal costs and
Q29: What are negative and positive externalities? How
Unlock this Answer For Free Now!
View this answer and more for free by performing one of the following actions

Scan the QR code to install the App and get 2 free unlocks

Unlock quizzes for free by uploading documents