Multiple Choice
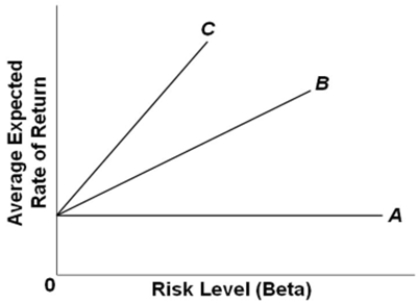 Refer to the graph.Which of the three Security Market Lines depicts the situation where investors most dislike risk?
A) line A
B) line B
C) line C
D) It cannot be determined from the graph.
Correct Answer:
Verified
Related Questions
Q91: The concept of time preference in financial
Q92: The risk premium of a financial asset
Q99: The line that depicts the relationship between
Q122: The rate of return on short-term U.S.
Q123: The average expected rate of return of
Q127: The average expected rate of return on
Unlock this Answer For Free Now!
View this answer and more for free by performing one of the following actions

Scan the QR code to install the App and get 2 free unlocks

Unlock quizzes for free by uploading documents