 Figure 9.4
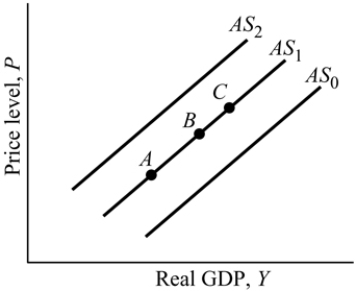
-Refer to Figure 9.4. An increase in aggregate supply is represented by:
A) a movement from Point C to Point A along AS1.
B) a shift from AS1 to AS2.
C) a movement from Point B to Point A along AS1.
D) a shift from AS1 to AS0.
Correct Answer:
Verified
Q53: Recall Application 1, "Measuring Price Stickiness in
Q54: Suppose there are three economies with 3
Q55: Compared to the long run aggregate supply
Q56: Rank these three wage rates in the
Q57: The curve that depicts aggregate demand slopes
Q59: Steel rod prices are an example of:
A)
Q60: The aggregate demand curve:
A) slopes upward.
B) slopes
Q61: If the economy is in equilibrium at
Q62: The aggregate supply curve depicts the relationship
Q63: ![]()
Unlock this Answer For Free Now!
View this answer and more for free by performing one of the following actions

Scan the QR code to install the App and get 2 free unlocks

Unlock quizzes for free by uploading documents