Refer to the below supply and demand graph.Point A represents the current equilibrium level of output of this product and point B represents the optimal level of output from society's perspective.This supply and demand graph indicates that there is (are) : 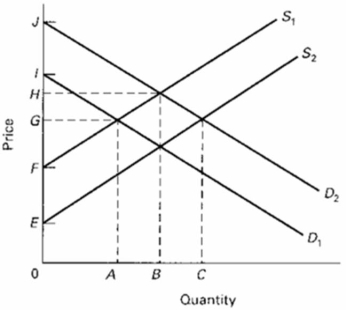
A) positive externalities to the production of this product.
B) negative externalities to the production of this product.
C) an overallocation of resources to the production of this product.
D) a negative externality from the production of this product.
Correct Answer:
Verified
Q87: Refer to the below diagram of the
Q88: If there are external benefits or positive
Q90: When producing a good generates external or
Q91: Suppose that a large tree on Shawn's
Q93: The Coase Theorem:
A)applies only to circumstances in
Q94: The Coase Theorem states that:
A)government should levy
Q95: If a good that generates negative externalities
Q96: Near an ocean beach, a high-rise building
Q97: The graphs below refer to two separate
Q149: If some activity creates external benefits as
Unlock this Answer For Free Now!
View this answer and more for free by performing one of the following actions

Scan the QR code to install the App and get 2 free unlocks

Unlock quizzes for free by uploading documents