Multiple Choice
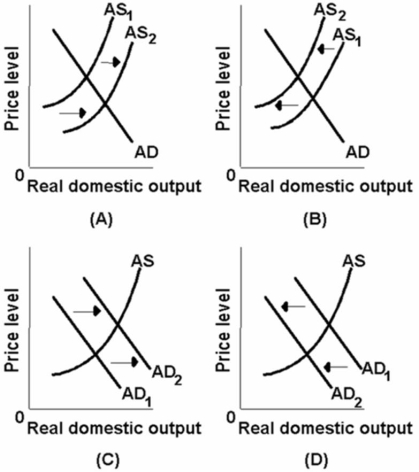 Which of the above diagrams best portrays the effects of a dramatic increase in energy prices?
A) A
B) B
C) C
D) D
Correct Answer:
Verified
Related Questions
Q56: Productivity measures
A) real output per unit of
Q68: The equilibrium price level and level of
Q114: An economy is employing 2 units of
Unlock this Answer For Free Now!
View this answer and more for free by performing one of the following actions

Scan the QR code to install the App and get 2 free unlocks

Unlock quizzes for free by uploading documents