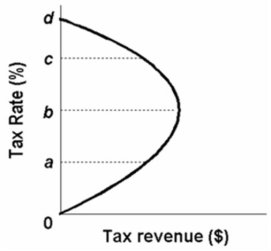
 The above diagram describes the notion that as tax:
A) revenues increase from zero to 100 percent, tax rates will increase from zero to some maximum level and then decline to zero.
B) rates increase from zero to 100 percent, tax revenue will increase from zero to some maximum level and decline to zero.
C) rates decrease from 100 to zero percent, tax revenue will decrease from 100 percent to a maximum level.
D) rates increase from zero to 100 percent, tax revenue will increase from zero to a maximum level.
Correct Answer:
Verified
Q110: Many economists doubt the proposition that supply-side
Q111: As real GDP increases the equilibrium point
Q112: Based on the Laffer Curve, a cut
Q113: Q114: A criticism of cuts in marginal tax Q116: Supply-side economists say that: Q117: Which of the following is not a Unlock this Answer For Free Now! View this answer and more for free by performing one of the following actions Scan the QR code to install the App and get 2 free unlocks Unlock quizzes for free by uploading documents![]()
A)lower tax rates on

