Use the figure below to answer the following questions.
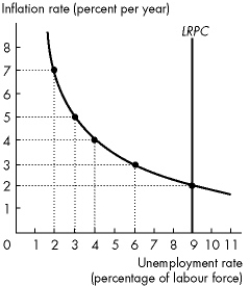 Figure 12.4.1
-Refer to Figure 12.4.1.The figure illustrates an economy's Phillips curves.What is the expected inflation rate?
A) 9 percent a year
B) 4 percent a year
C) 7 percent a year
D) 2 percent a year
E) cannot be determined without more information
Correct Answer:
Verified
Q84: Use the table below to answer the
Q85: For a given expected inflation rate, the
Q86: If the natural unemployment rate rises
A)the long-
Q87: Use the figure below to answer the
Q88: Use the table below to answer the
Q90: If the unemployment rate rises and the
Q91: The short- run Phillips curve shows the
Q92: If the natural unemployment rate falls
A)the short-
Q93: A movement down along the short- run
Q94: If the inflation rate is lower than
Unlock this Answer For Free Now!
View this answer and more for free by performing one of the following actions

Scan the QR code to install the App and get 2 free unlocks

Unlock quizzes for free by uploading documents