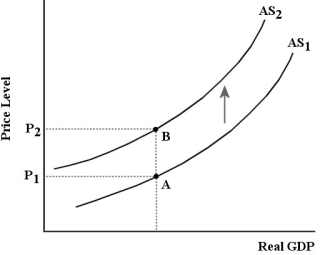
 FIGURE 23-2
-Refer to Figure 23-2. The shift from AS1 to AS2 shown in the diagram is referred to as an)
A) increase in aggregate supply.
B) increase in unit costs.
C) negative aggregate supply shock.
D) positive aggregate supply shock.
E) decrease in unit costs.
Correct Answer:
Verified
Q61: Suppose there is a drop in the
Q75: Consider the basic AD/AS model.Suppose that a
Q81: The aggregate supply curve is usually assumed
Q84: Consider the basic AD/AS model.Real GDP is
Q88: The concept of "demand-determined output" requires _
Q90: If the economy's AS curve is upward
Q92: Consider the nature of macroeconomic equilibrium.If,at a
Q92: If the AS curve is vertical and
Q95: Consider the nature of macroeconomic equilibrium.If,at a
Q98: The aggregate supply curve tends to be
Unlock this Answer For Free Now!
View this answer and more for free by performing one of the following actions

Scan the QR code to install the App and get 2 free unlocks

Unlock quizzes for free by uploading documents