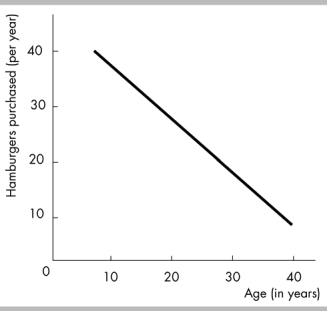
-The above figure depicts a
A) negative non-linear relationship between age and the number of hamburgers purchased per year.
B) positive non-linear relationship between age and the number of hamburgers purchased per year.
C) positive linear relationship between age and the number of hamburgers purchased per year.
D) negative linear relationship between age and the number of hamburgers purchased per year.
Correct Answer:
Verified
Q304: Q306: If a graph shows a negative relationship Q307: Q308: Suppose that we find that student grades Q308: Q309: As a curve approaches a maximum point, Q310: Q312: The faster an automobile is driven speed), Q314: If the quantity of wood purchased decreases Q315: Unlock this Answer For Free Now! View this answer and more for free by performing one of the following actions Scan the QR code to install the App and get 2 free unlocks Unlock quizzes for free by uploading documents![]()
![]()
![]()
![]()
![]()

