Multiple Choice
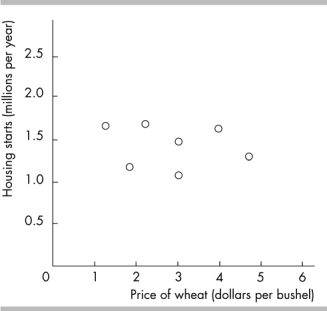
-The above figure graphs the price of a bushel of wheat and housing starts. The graph shows the variables are
A) strongly positively related.
B) related via an indirect relationship.
C) not related.
D) strongly negatively related.
Correct Answer:
Verified
Related Questions
Q234: If the government raises the tax on
Q241: Q242: The horizontal axis in a graph Q244: Q245: The value of the x-coordinate of a Q247: Q248: A scatter diagram will be most useful Q256: When I buy an $8.00 movie ticket Q257: Suppose you plan to go to school Q261: Unlock this Answer For Free Now! View this answer and more for free by performing one of the following actions Scan the QR code to install the App and get 2 free unlocks Unlock quizzes for free by uploading documents![]()
A) is![]()
![]()
A)![]()

