Multiple Choice
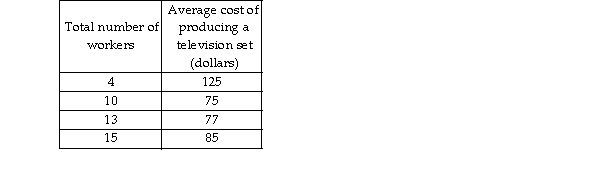
-Graphing the data in the above table with the number of workers on the horizontal axis and the average cost on the vertical axis, the graph would show
A) no relationship.
B) first a negative and then a positive relationship.
C) a horizontal line.
D) a linear relationship.
Correct Answer:
Verified
Related Questions

