The diagram below shows two production possibilities boundaries for Country X.
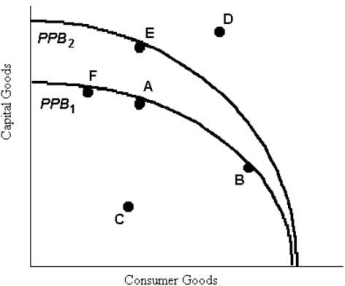 FIGURE 1- 4
-Refer to Figure 1- 4.If Country X were producing at point C,
A) it is not possible to move to any point on PPB1 or PPB2 without technological progress.
B) the opportunity cost of moving to point A is to give up some capital goods.
C) the opportunity cost of moving to point B is to give up some consumption goods.
D) the opportunity cost of moving to point A is zero.
E) this is the maximum output possible from given resources.
Correct Answer:
Verified
Q4: With a budget of $500 000,a school
Q25: The table below shows that,in one
Q26: The famous economist who first described the
Q27: Consider a production possibilities boundary showing the
Q28: The table below shows that,in one
Q29: Which of the following statements provides the
Q31: Suppose drought destroys many millions of acres
Q33: Which of the following is illustrated by
Q34: In command economies,economic behaviour is
A)largely affected by
Q35: The diagram below shows two production possibilities
Unlock this Answer For Free Now!
View this answer and more for free by performing one of the following actions

Scan the QR code to install the App and get 2 free unlocks

Unlock quizzes for free by uploading documents