The diagram below shows the MRP curve for a firm producing copper plumbing pipe.The factor of production being considered here is hours of labour.
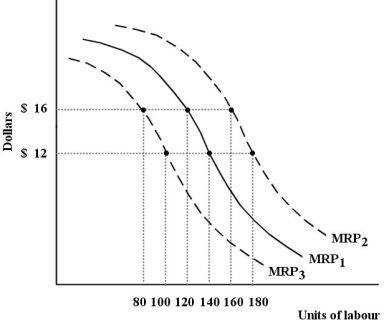 FIGURE 13- 2
-Refer to Figure 13- 2.This firm's MRP curve is the firm's
A) market demand curve for copper plumbing pipe.
B) demand curve for labour.
C) total product curve for labour.
D) marginal product of labour curve.
E) derived demand for copper plumbing pipe.
Correct Answer:
Verified
Q78: Which of the following concepts is most
Q79: Consider the following production and cost
Q80: Consider the following production and cost
Q81: The table below shows the total
Q82: Consider the following production and cost
Q84: Consider the following production and cost
Q85: If a given factor of production is
Q86: Consider the following production and cost
Q87: Consider the following demand and supply curves
Q88: Consider the following demand and supply curves
Unlock this Answer For Free Now!
View this answer and more for free by performing one of the following actions

Scan the QR code to install the App and get 2 free unlocks

Unlock quizzes for free by uploading documents