The diagram below shows the MRP curve for a firm producing copper plumbing pipe.The factor of production being considered here is hours of labour.
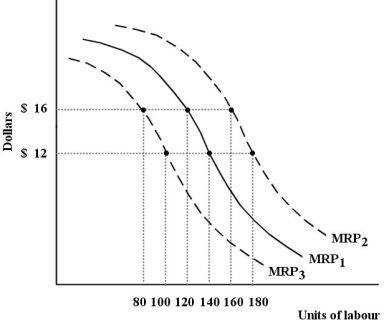 FIGURE 13- 2
-Refer to Figure 13- 2.Suppose this firm initially has the marginal revenue product curve MRP1.One reason that the curve could shift to MRP2 is
A) a decrease in the market price of copper plumbing pipe.
B) an increase in the supply of labour.
C) a decrease in demand for the firm's output,copper plumbing pipe.
D) a decrease in the wage rate.
E) an improvement in workers' human capital.
Correct Answer:
Verified
Q95: FIGURE 13- 3 The demand and supply
Q96: Consider the following production and cost
Q97: When studying income distribution,the Classical economists were
Q98: FIGURE 13- 3 The demand and supply
Q99: Consider the following production and cost
Q101: Consider a manufacturing plant as an example
Q102: The "functional distribution of income" refers to
Q103: The diagram below shows the MRP curve
Q104: Consider the following production and cost
Q105: Steve Nash is a highly paid professional
Unlock this Answer For Free Now!
View this answer and more for free by performing one of the following actions

Scan the QR code to install the App and get 2 free unlocks

Unlock quizzes for free by uploading documents