The diagram below shows the MRP curve for a firm producing copper plumbing pipe.The factor of production being considered here is hours of labour.
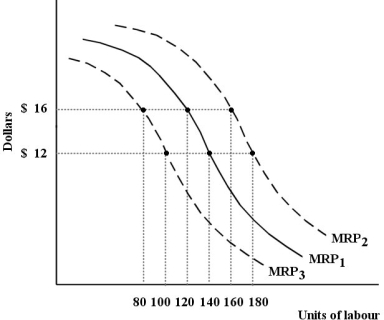 FIGURE 13- 2
-Refer to Figure 13- 2.Suppose this firm is facing MRP1,a wage rate of $12 per hour and is employing 150 units of labour.At this level of employment,
A) the last unit of labour contributes as much to the firm's costs as to the firm's revenues and so the firm should not change its use of labour.
B) the last unit of labour is adding less to the firm's cost than it is adding to the firm's revenue,so it should increase the use of labour.
C) the firm has shifted the MRP curve to MRP2.
D) the last unit of labour is adding more to the firm's cost than it is adding to the firm's revenue,so it should reduce the use of labour.
E) the firm has shifted the MRP curve to MRP3.
Correct Answer:
Verified
Q24: If the supply curve for a factor
Q25: Consider labour that is hired for $18
Q26: FIGURE 13- 4 The three diagrams below
Q27: Consider the following production and cost
Q28: The table below shows the total
Q30: Consider the following demand and supply curves
Q31: Choose the statement that best describes the
Q32: Consider the following demand and supply curves
Q33: Consider a firm's demand curve for labour.If
Q34: Consider the following production and cost
Unlock this Answer For Free Now!
View this answer and more for free by performing one of the following actions

Scan the QR code to install the App and get 2 free unlocks

Unlock quizzes for free by uploading documents