FIGURE 8- 2 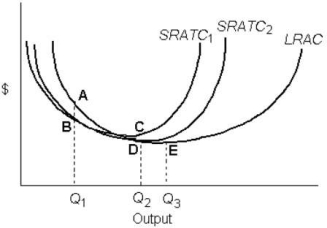
-Refer to Figure 8- 2.Decreasing returns to scale occur over the output range
A) Q2 to Q3 only.
B) 0 to Q3 only.
C) beyond Q3 only.
D) Q1 to Q2 only.
E) 0 to Q1 only.
Correct Answer:
Verified
Q39: The figure below shows a family of
Q40: The following table shows the marginal
Q41: A firm's long- run average cost curve
A)is
Q42: The figure below shows the isocost lines
Q44: Assume a firm is using 6 units
Q45: Suppose Farmer Smith hires 4 workers and
Q46: Canada has a much lower population density
Q47: A cost- minimizing firm will increase its
Q48: What is meant by the term "increasing
Q65: ![]()
Unlock this Answer For Free Now!
View this answer and more for free by performing one of the following actions

Scan the QR code to install the App and get 2 free unlocks

Unlock quizzes for free by uploading documents