Multiple Choice
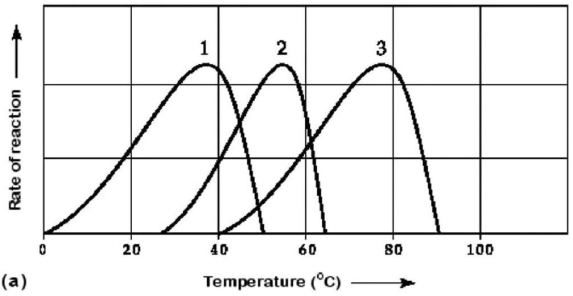
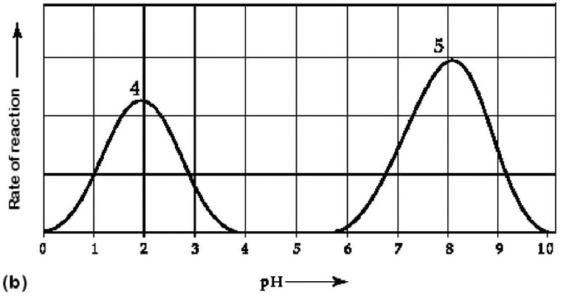 Figure 6.3 Activity of various enzymes (a) at various temperatures and (b) at various pH.
-Which temperature and pH profile curves on the graphs in Figure 6.3 were most likely generated from analysis of an enzyme from a human stomach,where conditions are strongly acidic?
A) curves 1 and 4
B) curves 1 and 5
C) curves 2 and 4
D) curves 2 and 5
E) curves 3 and 4
Correct Answer:
Verified
Related Questions

