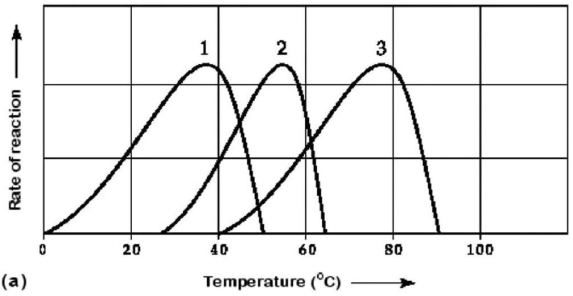
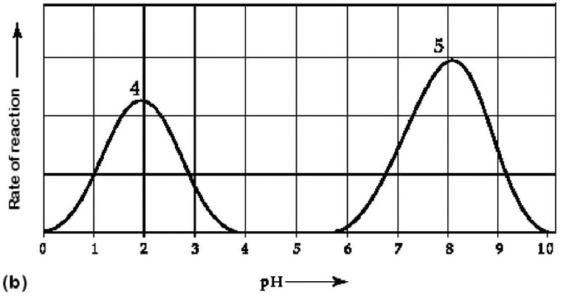
 Figure 6.3 Activity of various enzymes (a) at various temperatures and (b) at various pH.
-Which curves on the graphs in Figure 6.3 may represent the temperature and pH profiles of an enzyme taken from a bacterium that lives in a mildly alkaline hot spring at temperatures of 70°C or higher?
A) curves 1 and 5
B) curves 2 and 4
C) curves 2 and 5
D) curves 3 and 4
E) curves 3 and 5
Correct Answer:
Verified
Q53: An enzyme-catalyzed reaction is conducted in a
Q54: Zinc,an essential trace element for most organisms,is
Q55: Q56: Why might a severe fever result in Q57: Which of the following is an example Q59: An enzyme-catalyzed reaction is conducted in a Q60: Some of the drugs used to treat Q61: Which of the following metabolic processes can Q62: Most cells cannot harness heat to perform Q63: Succinate dehydrogenase catalyzes the conversion of succinate![]()
Unlock this Answer For Free Now!
View this answer and more for free by performing one of the following actions

Scan the QR code to install the App and get 2 free unlocks

Unlock quizzes for free by uploading documents