Researchers obtained the data depicted in this figure by sampling human blood containing HIV and then isolating and sequencing genes within the human immunodeficiency virus's DNA .What does the y-axis represent? 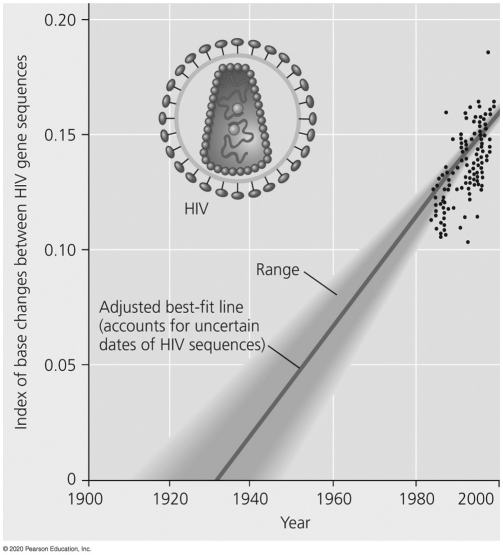
A) an index of natural selection on the HIV genes studied
B) an index of mutations within gene regions of HIV that are unrelated to the success of the virus (such as how virulent it is or how well it reproduces within its human hosts)
C) a measurement of changes between HIV gene sequences,specifically on genes important for the replication,reproduction,and spreading of the virus
D) an index of time since the first human HIV infection occurred
Correct Answer:
Verified
Q29: There is some evidence that extinct reptiles
Q30: Which of the following is true of
Q31: A phylogenetic tree shows that birds and
Q32: Which of the following are problematic when
Q33: The observation that genetic mutations in the
Q33: The most important feature that permits a
Q35: How does a molecular clock measure time?
A)by
Q36: A shared ancestral character is
A)a character that
Q37: Which kind of DNA should provide the
Q38: Which of these would,if it (they)had acted
Unlock this Answer For Free Now!
View this answer and more for free by performing one of the following actions

Scan the QR code to install the App and get 2 free unlocks

Unlock quizzes for free by uploading documents