TABLE 2-11
The histogram below represents scores achieved by 200 job applicants on a personality profile.
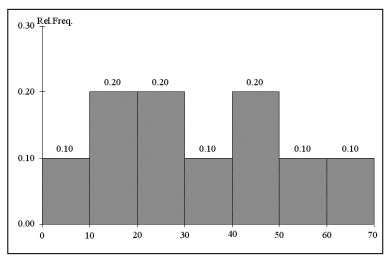
-Referring to the histogram from Table 2-11, 90% of the job applicants scored above or equal to ________.
Correct Answer:
Verified
Q125: TABLE 2-10
The frequency distribution below represents the
Q126: TABLE 2-11
The histogram below represents scores achieved
Q127: TABLE 2-10
The frequency distribution below represents the
Q128: TABLE 2-11
The histogram below represents scores achieved
Q129: TABLE 2-12
The ordered array below resulted from
Q131: TABLE 2-10
The frequency distribution below represents the
Q132: TABLE 2-11
The histogram below represents scores achieved
Q133: TABLE 2-9
The Stem-and-Leaf display represents the number
Q134: TABLE 2-9
The Stem-and-Leaf display represents the number
Q135: TABLE 2-11
The histogram below represents scores achieved
Unlock this Answer For Free Now!
View this answer and more for free by performing one of the following actions

Scan the QR code to install the App and get 2 free unlocks

Unlock quizzes for free by uploading documents