TABLE 16-5
A contractor developed a multiplicative time-series model to forecast the number of contracts in future quarters, using quarterly data on number of contracts during the 3-year period from 2006 to 2008. The following is the resulting regression equation:

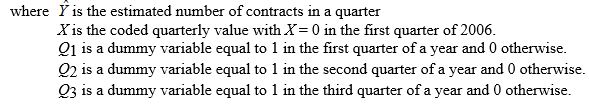
-Referring to Table 16-5, in testing the coefficient of X in the regression equation (0.117) the results were a t-statistic of 9.08 and an associated p-value of 0.0000. Which of the following is the best interpretation of this result?
A) The quarterly growth rate in the number of contracts is significantly different from 0% (α = 0.05) .
B) The quarterly growth rate in the number of contracts is not significantly different from 0% (α = 0.05) .
C) The quarterly growth rate in the number of contracts is significantly different from 100% (α = 0.05) .
D) The quarterly growth rate in the number of contracts is not significantly different from 100% (α = 0.05) .
Correct Answer:
Verified
Q3: Given a data set with 15 yearly
Q23: The method of least squares may be
Q24: Each forecast using the method of exponential
Q31: The principle of parsimony indicates that the
Q38: MAD is the summation of the residuals
Q49: TABLE 16-5
A contractor developed a multiplicative time-series
Q52: TABLE 16-5
A contractor developed a multiplicative time-series
Q56: TABLE 16-5
A contractor developed a multiplicative time-series
Q58: TABLE 16-5
A contractor developed a multiplicative time-series
Q189: In selecting a forecasting model, we should
Unlock this Answer For Free Now!
View this answer and more for free by performing one of the following actions

Scan the QR code to install the App and get 2 free unlocks

Unlock quizzes for free by uploading documents