In this figure, the unshaded area represents ______. 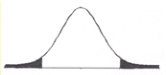
A) the region of rejection
B) the region of acceptance
C) values of the statistic with a relatively low probability of occurring
D) the region of non-rejection
Correct Answer:
Verified
Q77: α refers to _.
A) the region of
Q78: In this figure, the shaded areas represent
Q79: A 'critical value' _.
A) is the same
Q80: The difference between the regions of rejection
Q81: You _ when the statistic falls in
Q83: You will make the decision to _
Q84: In this figure, the unshaded area represents
Q85: In this figure, if the value of
Q86: You _ when the statistic falls in
Q87: You _ the null hypothesis when the
Unlock this Answer For Free Now!
View this answer and more for free by performing one of the following actions

Scan the QR code to install the App and get 2 free unlocks

Unlock quizzes for free by uploading documents