Which of these statistics BEST describes the relationship in this scatterplot? 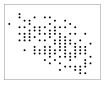
A) r = -1.00
B) r = .10
C) r = .50
D) r = -.45
Correct Answer:
Verified
Q51: Which of these statistics BEST describes the
Q52: A Pearson correlation of _ is BEST
Q53: An instructor finds she is completely unable
Q54: Which of these statistics best describes the
Q55: A Pearson correlation of _ is BEST
Q57: An instructor finds the more often students
Q58: Which of these statistics BEST describes the
Q59: A correlation of _ is BEST represented
Q60: A researcher finds that the more hours
Q61: Which of the following statements BEST illustrates
Unlock this Answer For Free Now!
View this answer and more for free by performing one of the following actions

Scan the QR code to install the App and get 2 free unlocks

Unlock quizzes for free by uploading documents