The following figure shows a portion of a consumer's indifference map and budget lines.The price of good Y is $7 and the consumer's income is $700.Let the consumer begin in utility-maximizing equilibrium at point A on indifference curve I.Next the price of good X changes so that the consumer moves to a new utility-maximizing equilibrium at point B on indifference curve II.The income effect of the change in the price of X is 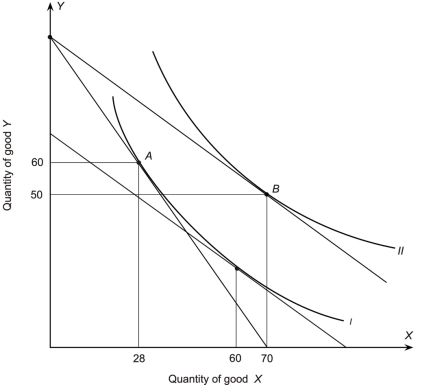
A) +12
B) +10
C) -10
D) +32
E) +42
Correct Answer:
Verified
Q90: The following figure shows a portion of
Q91: The figure below shows a consumer maximizing
Q92: The figure below shows a consumer maximizing
Q93: The figure below shows a consumer maximizing
Q94: The following figure shows a portion of
Q96: The figure below shows a consumer maximizing
Q97: The following figure shows a portion of
Q98: A consumer has the indifference map shown
Q99: The figure below shows a consumer maximizing
Q100: The following figure shows a portion of
Unlock this Answer For Free Now!
View this answer and more for free by performing one of the following actions

Scan the QR code to install the App and get 2 free unlocks

Unlock quizzes for free by uploading documents