The figure below shows a consumer maximizing utility at two different prices (the left panel) and the consumer's demand for good X at the same two prices of good X (the right panel) .The price of good Y is $4.50.What is the consumer's income? 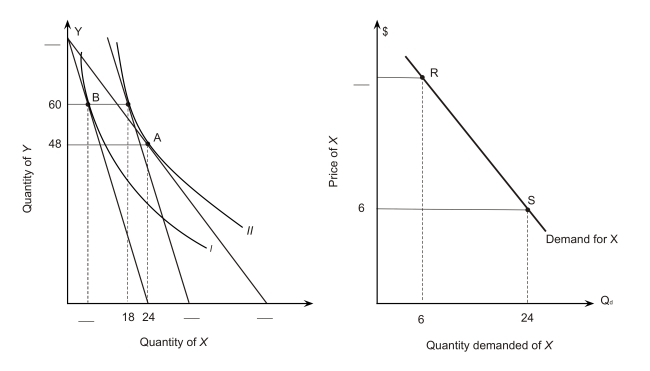
A) $250
B) $280
C) $320
D) $360
E) $400
Correct Answer:
Verified
Q58: In the following graph the price
Q59: Assume that an individual consumes two
Q60: In the following graph the price
Q61: Refer to the following indifference map for
Q62: The figure below shows a consumer maximizing
Q64: In the figure below,a consumer faces a
Q65: The figure below shows a consumer maximizing
Q66: Refer to the following indifference map for
Q67: Refer to the following indifference map for
Q68: The figure below shows a consumer maximizing
Unlock this Answer For Free Now!
View this answer and more for free by performing one of the following actions

Scan the QR code to install the App and get 2 free unlocks

Unlock quizzes for free by uploading documents