The figure below shows a consumer maximizing utility at two different prices (the left panel) and the consumer's demand for good X at the same two prices of good X (the right panel) .The price of good Y is $14.At point r on indifference curve I,the MRS is _____ and _____ units of good X are purchased. 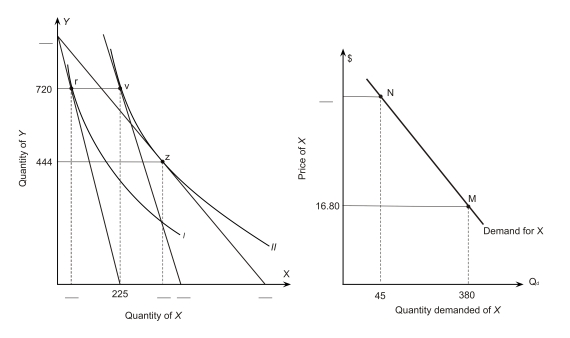
A) 2; 40
B) 2; 45
C) 4; 40
D) 4; 45
E) 5; 45
Correct Answer:
Verified
Q73: Market demand
A)is the horizontal summation of the
Q74: The market demand curve
A)shows how much all
Q75: The figure below shows a consumer maximizing
Q76: The figure below shows a consumer maximizing
Q77: The figure below shows a consumer maximizing
Q79: The figure below shows a consumer maximizing
Q80: The figure below shows a consumer maximizing
Q81: The following figure shows a portion of
Q82: The following figure shows a portion of
Q83: The following figure shows a portion of
Unlock this Answer For Free Now!
View this answer and more for free by performing one of the following actions

Scan the QR code to install the App and get 2 free unlocks

Unlock quizzes for free by uploading documents