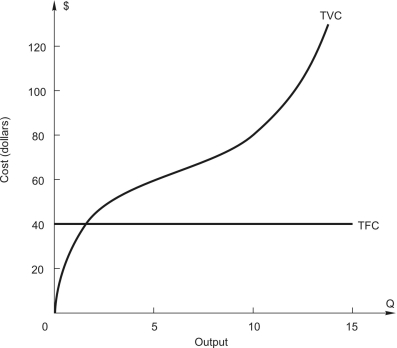
 In the above figure,what is the AVERAGE total cost of producing 10 units of output?
A) $4
B) $8
C) $12
D) $50
E) $360
Correct Answer:
Verified
Q90: The following graph shows the marginal and
Q91: The following graph shows the marginal and
Q92: To answer,refer to the following: "Ford built
Q93: The following graph shows the marginal and
Q94: The following graph shows the marginal and
Q96: The following graph shows the marginal and
Q97: The capital stock is fixed at
Q98: The following graph shows the marginal and
Q99: The following graph shows the marginal and
Q100: ![]()
Unlock this Answer For Free Now!
View this answer and more for free by performing one of the following actions

Scan the QR code to install the App and get 2 free unlocks

Unlock quizzes for free by uploading documents