The following graph shows the demands and marginal revenue in two markets,1 and 2,for a price discriminating firm along with total marginal revenue,MRT,and marginal cost. 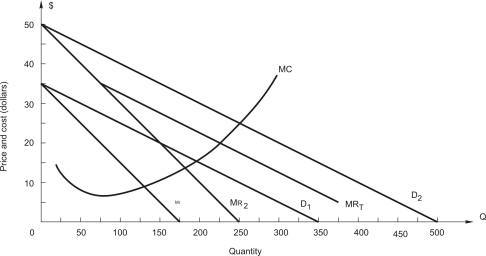 How should the firm allocate sales between the two markets?
A) 150 in each market
B) 100 in market 1,175 in 2
C) 150 in market 1,300 in 2
D) 112.5 in each market
E) 75 in market 1,150 in 2
Correct Answer:
Verified
Q34: A firm is producing two goods
Q35: A firm sells two goods (X
Q36: The following graph shows the demands and
Q37: A firm sells two goods (X
Q38: A news magazine offers students a discount
Q40: A firm sells two goods (X
Unlock this Answer For Free Now!
View this answer and more for free by performing one of the following actions

Scan the QR code to install the App and get 2 free unlocks

Unlock quizzes for free by uploading documents