Consider the graph which represents a local power plant.The production process includes the dumping of waste in the local river.The level of output QPrivate
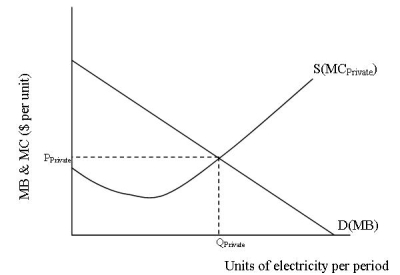
A) represents an efficient allocation of resources for the production of electricity.
B) represents an overallocation of resources for the production of electricity.
C) represents an underallocation of resources for the production of electricity.
D) represents a cost-effective allocation of resources for the production of electricity.
Correct Answer:
Verified
Q1: Consider the graph of the marginal costs
Q2: Social market costs include
A)private marginal costs.
B)the negative
Q3: Use the graph to answer questions
Q4: Which of the following is an example
Q5: Marginal costs born only by the producer
Q7: Pollution is an example of
A)a positive externality.
B)a
Q8: External costs can be defined as
A)the difference
Q9: Marginal benefits from producing a product that
Q10: Use the graph to answer questions
Q11: When the market system does not generate
Unlock this Answer For Free Now!
View this answer and more for free by performing one of the following actions

Scan the QR code to install the App and get 2 free unlocks

Unlock quizzes for free by uploading documents