Use the following to answer questions .
Exhibit: Consumption Functions
Figure 13-3 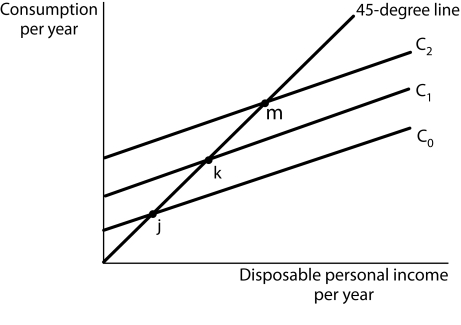
-(Exhibit: Consumption Functions) Upward shifts of the consumption function, for example from C0 to C1 to C2 demonstrate
A) an increase in the marginal propensity to save.
B) increases in the amount of consumption for a given level of disposable income.
C) increases in the amount of disposable income available for consumption.
D) a decrease in the marginal propensity to save.
Correct Answer:
Verified
Q39: Personal saving is
A) total income not spent
Q40: In graph that shows disposable income on
Q41: Use the following to answer questions .
Exhibit:
Q42: Use the following to answer questions .
Exhibit:
Q43: Use the following to answer questions .
Exhibit:
Q45: According to the current income hypothesis,
A) a
Q46: The average annual income that people expect
Q47: Suppose the consumption function is C =
Q48: Use the following to answer questions .
Exhibit:
Q49: Suppose the consumption function is C =
Unlock this Answer For Free Now!
View this answer and more for free by performing one of the following actions

Scan the QR code to install the App and get 2 free unlocks

Unlock quizzes for free by uploading documents