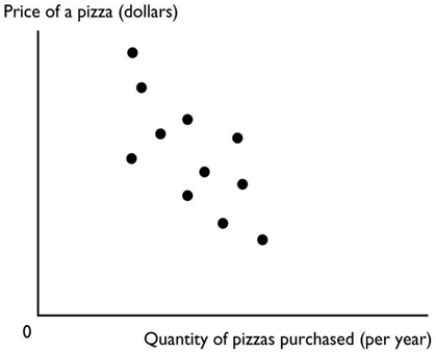
-The figure above shows a
A) slope.
B) cross-section graph.
C) time-series graph.
D) scatter diagram.
E) trend diagram.
Correct Answer:
Verified
Q64: Which type of economic graph reveals trends
Q65: When the Adelaide Crows score more than
Q67: To show how a variable _, we
Q68: Which of the following is NOT a
Q70: A trend is
A) a measure of closeness
Q71: A graph of the value of one
Q72: A graph shows the wage rate of
Q73: If there is no scarcity,
A) choices are
Q74: If the marginal benefit of the next
Q137: The marginal benefit of an activity is
Unlock this Answer For Free Now!
View this answer and more for free by performing one of the following actions

Scan the QR code to install the App and get 2 free unlocks

Unlock quizzes for free by uploading documents