Solved

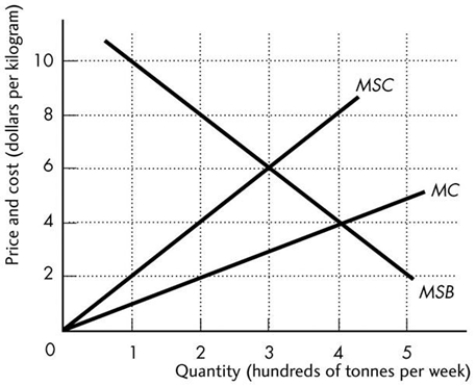
-The Above Figure Shows the Marginal Private Cost Curve, Marginal

Question 63

Multiple Choice

  -The above figure shows the marginal private cost curve, marginal social cost curve, and marginal social benefit curve for blue fin tuna, a common resource. A quota to prevent the over-fishing of the tuna sets the catch equal to A)  300 tonnes per week. B)  200 tonnes per week. C)  500 tonnes per week. D)  zero tonnes per week. E)  400 tonnes per week.
-The above figure shows the marginal private cost curve, marginal social cost curve, and marginal social benefit curve for blue fin tuna, a common resource. A quota to prevent the over-fishing of the tuna sets the catch equal to


A) 300 tonnes per week.
B) 200 tonnes per week.
C) 500 tonnes per week.
D) zero tonnes per week.
E) 400 tonnes per week.

Correct Answer:

verifed

Verified

Unlock this answer now
Get Access to more Verified Answers free of charge

Related Questions

Unlock this Answer For Free Now!

View this answer and more for free by performing one of the following actions

qr-code

Scan the QR code to install the App and get 2 free unlocks

upload documents

Unlock quizzes for free by uploading documents