Using the graph below, answer the questions that follow.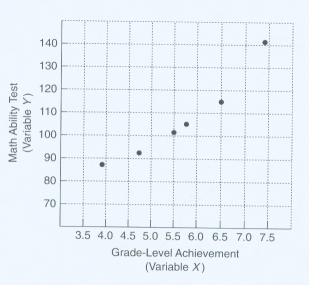
-Given the general flow of the direction of the data, these variables are likely to be which of the following?
A) Positively correlated
B) Negatively correlated
C) Possess no correlation
D) There is no way to tell correlation from visual interpretation of data.
Correct Answer:
Verified
Q66: Correlation is represented by what symbol?
A) ∑
B)
Q67: When an instrument can predict performance on
Q68: The type of reliability that can look
Q69: Discuss the positives and negatives of the
Q70: Using the graph below, answer the questions
Q72: How would the use of standard error
Q73: Discuss the reasons why interrater reliability is
Q74: Establishing interrater reliability is especially important when
Q75: Discuss some potential challenges associated with the
Q76: Which of the following options would most
Unlock this Answer For Free Now!
View this answer and more for free by performing one of the following actions

Scan the QR code to install the App and get 2 free unlocks

Unlock quizzes for free by uploading documents