Table 1.2 shows the hypothetical trade-off between different combinations of Stealth bombers and B-1 bombers that might be produced in a year with the limited U.S.capacity,ceteris paribus.Complete the table by calculating the required opportunity costs for both the B-1 and Stealth bombers. 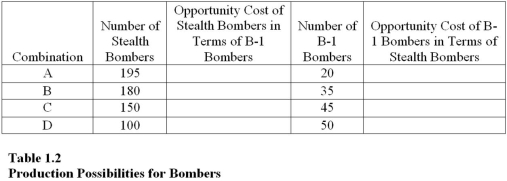
-Refer to Table 1.2.In the production range of 20 to 35 B-1 bombers,the opportunity cost of producing 1 more B-1 bomber is
A) 195/20 of Stealth bombers.
B) 35/20 of Stealth bombers.
C) 15 Stealth bombers.
D) 1 Stealth bomber.
Correct Answer:
Verified
Q83: Table 1.3 shows the hypothetical trade-off between
Q84: Table 1.2 shows the hypothetical trade-off between
Q85: Use the following figure to answer the
Q86: Use the following figure to answer the
Q87: When the relationship between two variables changes,
A)There
Q90: Table 1.3 shows the hypothetical trade-off between
Q91: One World View article is titled "Chronic
Q92: Table 1.2 shows the hypothetical trade-off between
Unlock this Answer For Free Now!
View this answer and more for free by performing one of the following actions

Scan the QR code to install the App and get 2 free unlocks

Unlock quizzes for free by uploading documents