Table 1.2 shows the hypothetical trade-off between different combinations of Stealth bombers and B-1 bombers that might be produced in a year with the limited U.S.capacity,ceteris paribus.Complete the table by calculating the required opportunity costs for both the B-1 and Stealth bombers. 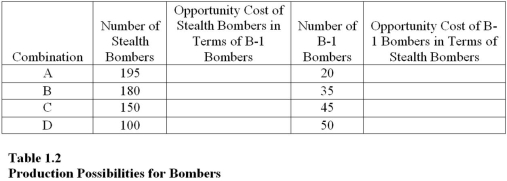 On the basis of your calculations in Table 1.2,
-what is the opportunity cost of producing at point B rather than point C?
A) 45 B-1 bombers.
B) 35 Stealth bombers.
C) 180 Stealth bombers.
D) 10 B-1 bombers.
Correct Answer:
Verified
Q68: Use the following figure to answer questions:
Q69: Use the following figure to answer questions:
Q70: Table 1.1 shows the hypothetical trade-off between
Q71: Use the following figure to answer questions:
Q72: Use the following figure to answer the
Q74: Use the following figure to answer the
Q75: Use the following figure to answer the
Q76: Table 1.1 shows the hypothetical trade-off between
Q77: Use the following figure to answer the
Q78: Use the following figure to answer the
Unlock this Answer For Free Now!
View this answer and more for free by performing one of the following actions

Scan the QR code to install the App and get 2 free unlocks

Unlock quizzes for free by uploading documents