Use the following figure to answer questions: Figure 1.4 1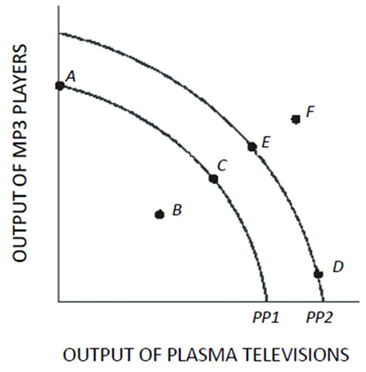
-In Figure 1.4,a shift of the production possibilities curve from PP1 to PP2 could be caused by
A) An increase in the unemployment rate.
B) Implementation of training programs that improve the skills of workers.
C) A flu epidemic that makes many workers sick.
D) Tougher pollution controls for the producers of plasma televisions and MP3 players.
Correct Answer:
Verified
Q62: Use the following figure to answer questions:
Q63: Use the following figure to answer questions:
Q64: Use the following figure to answer the
Q65: Table 1.2 shows the hypothetical trade-off between
Q66: Table 1.1 shows the hypothetical trade-off between
Q68: Use the following figure to answer questions:
Q69: Use the following figure to answer questions:
Q70: Table 1.1 shows the hypothetical trade-off between
Q71: Use the following figure to answer questions:
Q72: Use the following figure to answer the
Unlock this Answer For Free Now!
View this answer and more for free by performing one of the following actions

Scan the QR code to install the App and get 2 free unlocks

Unlock quizzes for free by uploading documents